
Skip to content
Website Leads & Statistics

How to View and Understand Your Website Statistics

Your website statistics help you see how people are finding and using your Site Before Night website. You can review visitor activity, page views, popular pages, traffic sources, and actions people take while they are on your site.

These numbers are most useful when you look for patterns over time. They can help you notice which pages receive the most attention, whether visitors are exploring more than one page, and which sources are sending people to your website.

How to view your website statistics

  1. Sign in to your website editor.
  2. Select Stats from the menu at the top of the editor.
  3. Choose the date range you want to review.
  4. Select Go to display the statistics for that period.

What your statistics can tell you

Your audience

Unique visitors, visits, and page views give you a quick picture of how much activity your website is receiving.

What people explore

Most viewed pages, pages per visit, time on the site, and bounce rate help you understand how visitors move through your content.

Where visits and actions come from

Traffic sources, inbound links, contact-form activity, tap-to-call actions, and mobile visits help show how people discover and interact with your business.

Helpful approach: avoid judging your website from one number or one unusually busy or quiet day. Comparing similar date ranges makes it easier to spot meaningful patterns.
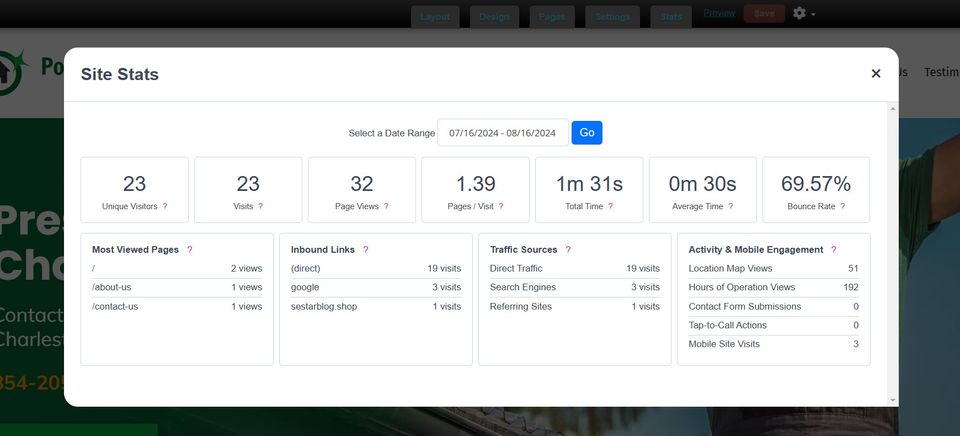
Ls 003 s1 ss1

What your website statistics mean

The Stats window combines several types of information. You do not need to become an analytics expert to use it. Start by understanding what each number represents, then look at several measurements together.

Visitors and page activity

Unique Visitors

An estimate of the distinct visitors who came to your website, based on the visitor and IP information tracked by the platform.

Visits

The total number of times your unique visitors collectively visited your website.

Page Views

The total number of times pages throughout your website were viewed.

Pages / Visit

The average number of website pages people view during a visit.

Time and engagement

Total Time

The combined amount of time visitors spent on your website during the selected reporting period.

Average Time

The average amount of time spent on your website per visit.

Bounce Rate

The percentage of visitors who leave after viewing only the homepage.

Most Viewed Pages

The pages on your website that received the most views during the selected period.

How people find your website

Inbound Links

External websites that referred visitors to your website.

Traffic Sources

The different ways people arrived at your website, such as direct traffic, search engines, or referring websites when those sources are reported.

Activity and mobile engagement

Location Map Views

The number of times visitors viewed the location map in your website footer.

Hours of Operation Views

The number of times visitors viewed the business-hours information in the footer.

Contact Form Submissions

The number of successfully submitted email contact forms recorded across the website.

Tap-to-Call Actions

The number of times visitors tapped a displayed phone number to place a call.

Mobile Site Visits

The number of website visits made from smaller-screen mobile devices.

How to use the numbers together

Look for patterns

Compare similar periods instead of reacting to one day. Consistent changes are usually more useful than isolated spikes or dips.

Notice popular content

Your Most Viewed Pages can show which parts of your website attract attention. Those pages are good places to double-check your message, contact information, and calls to action.

Connect traffic with action

Visitor counts are only part of the picture. Also pay attention to actions such as contact-form submissions and tap-to-call activity when evaluating how people use the site.